

For adults it is 90%.

Thankfully we are still more generous towards children en masse - albeit just slightly.
I want to introduce the concept of the Service Level Ratio - SLR. Let’s call these National Health Service (UK) statistics: subsidized-SLRs because England’s NHS is a publicly funded enterprise.
And let’s flip the ratio above to fit this frame. For example, if 90% of dental practices are refusing new patients that equates to a SLR of 0.1 or 10%.
Why would a service provider turn away new clients?
The two simplest answers:
There is no capacity to serve new clients; or
Another client segment has means to pay more.
According to George Monbiot (I’ll cover him in a future essay) - an arcane billing system ensures that NHS dentists will lose money on every procedure leaving only the most altruistic among us to work harder for less pay, perhaps out of a personal moral duty to serve.
Let’s go further.
Why should we the people promote / fund / support an organization (the government in this case) whose SLR has dropped to 10%?
In fact, the NHS achieved its peak SLR of 52.4 % in 2010 - itself a weak “health” ratio if judged on many commercial standards.
Let’s go further.
Which camp are you in?
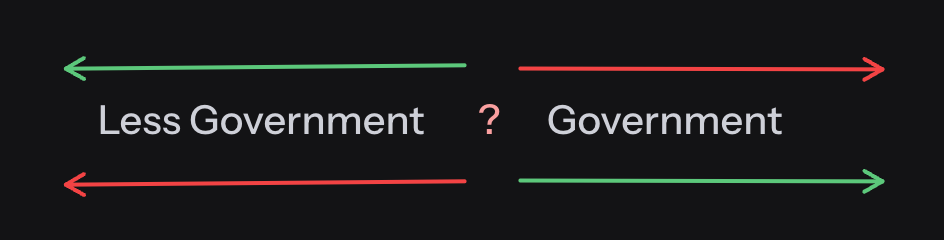
Hopefully you don’t fall for this Straw-man trap because life exists on a spectrum and sometimes we go too far in one direction. Unfortunately powerful interests adeptly paint a binary picture for us, encouraging us to avoid healthy debate; instead fanning the flames of existential crises.

Even facts lie on a spectrum in today’s era; highlighted by recent history.
Society can and sometimes does stray two standard deviations (2 S.D.) from the norm, especially in times of incompetence and over-reach. When this happens - there is a correction.
Intuitively, a three standard deviation (3 S.D.) move is probably limited to a Black Swan event such as civil war / regime change, genocide or hyperinflation.
In honor of October let me try a baseball metaphor - during a correction it’s as if someone hits a home-run but takes a long time to run the bases; only to find out home plate is missing on the way back.
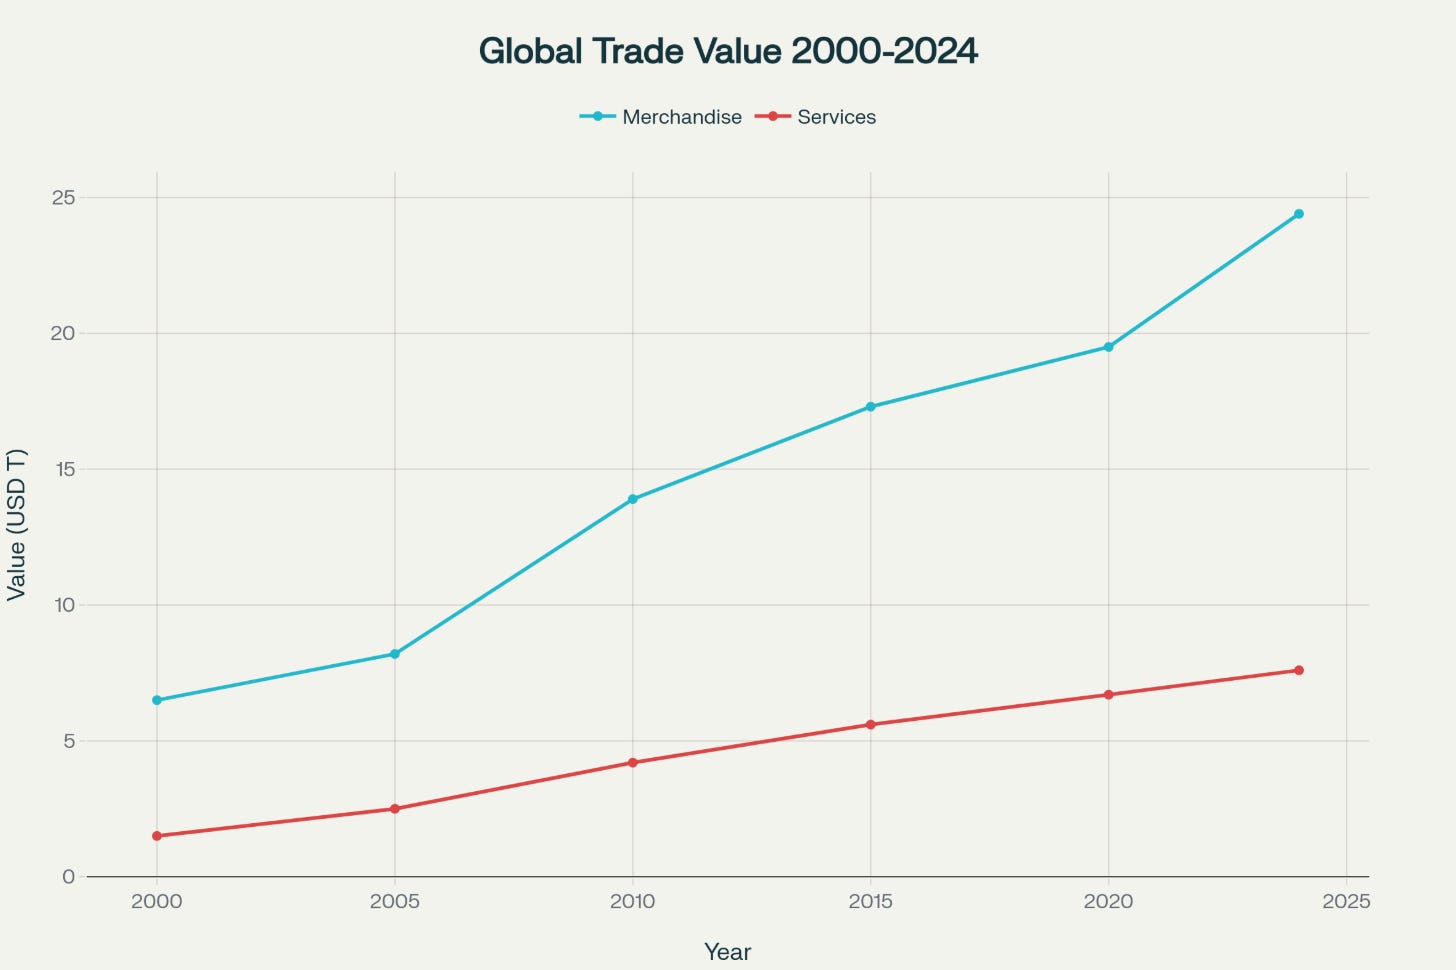
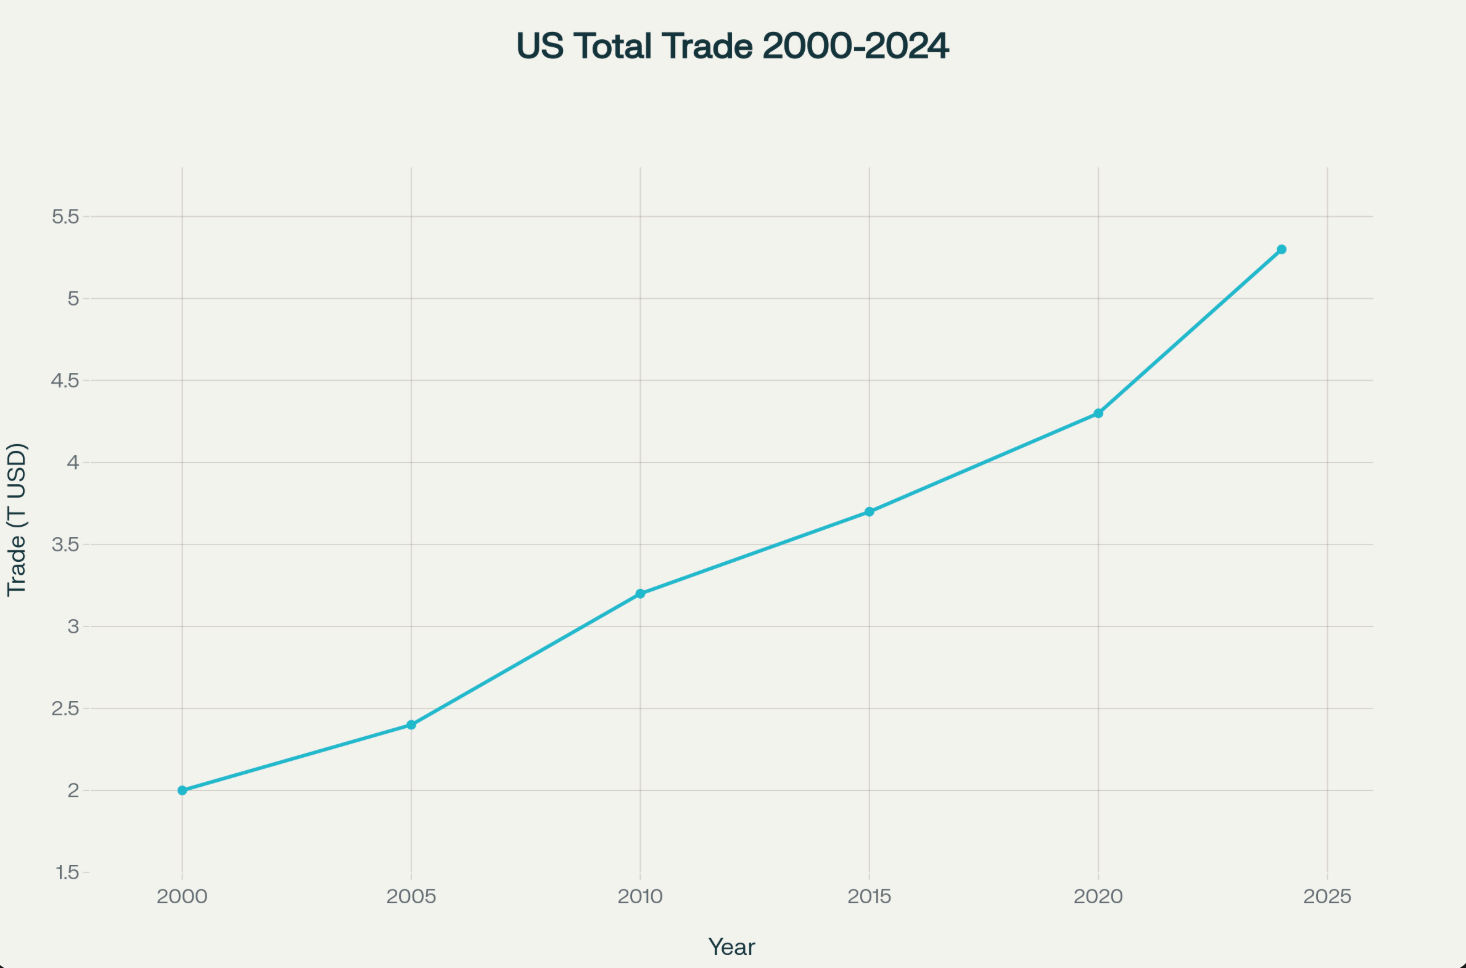
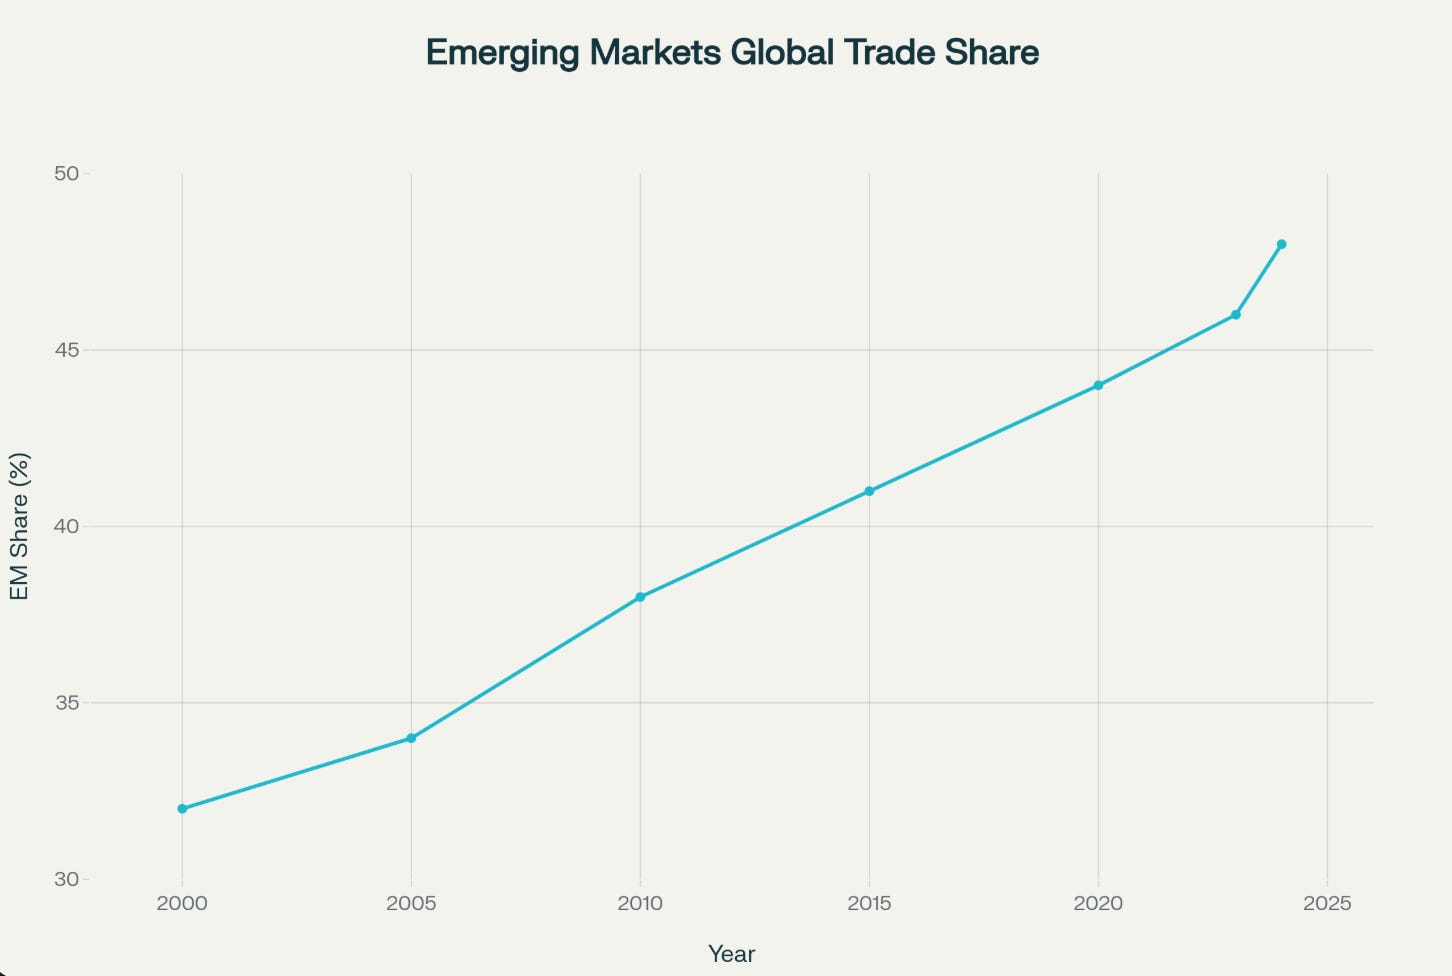
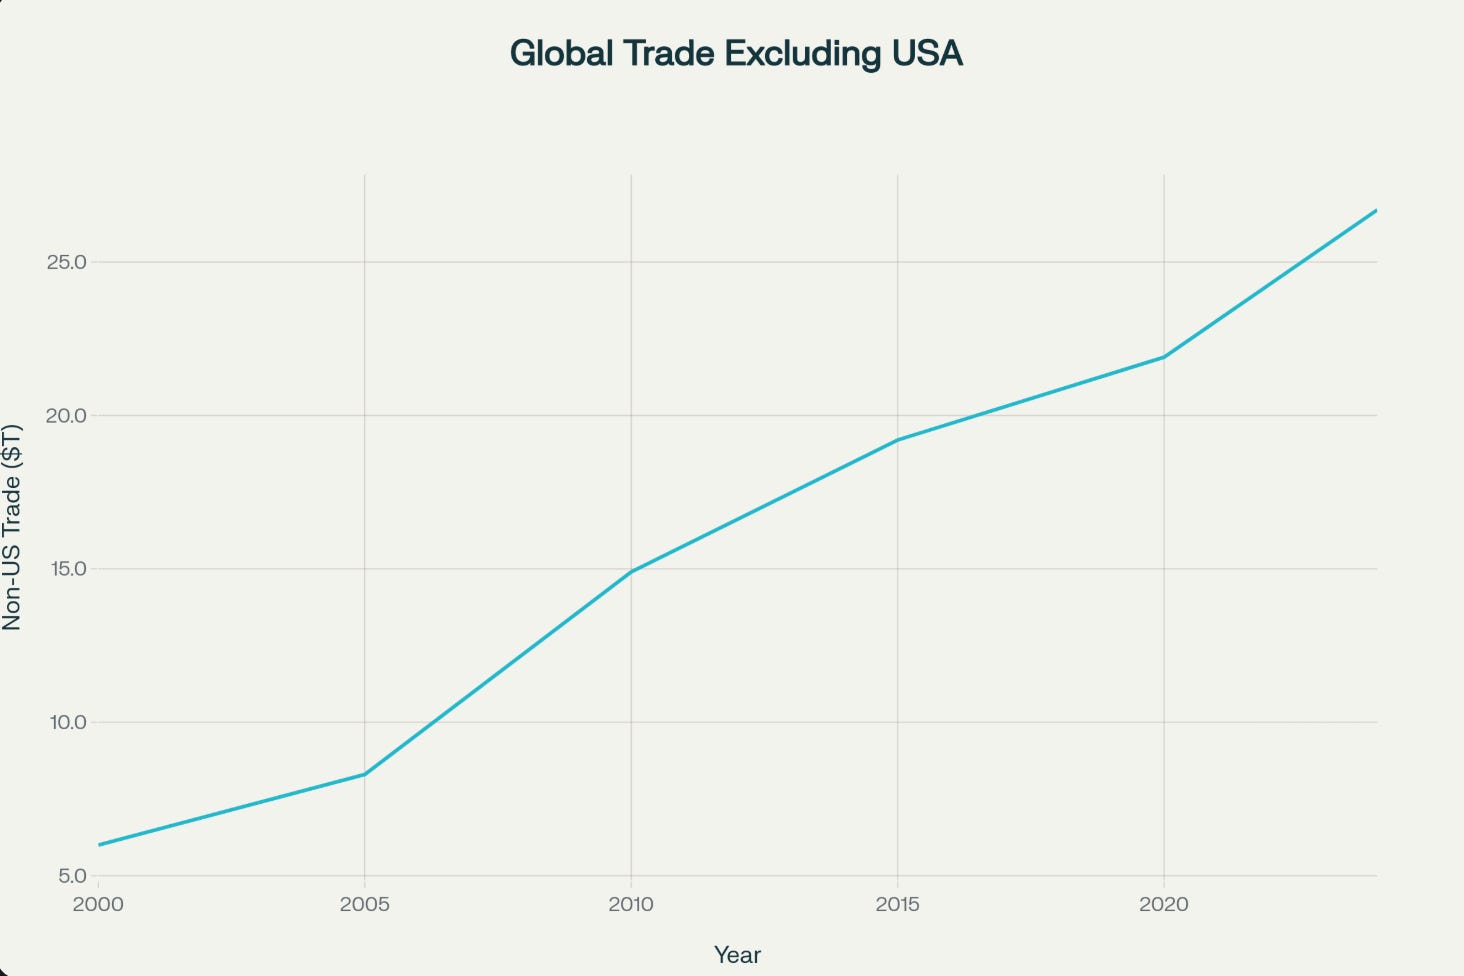
Have a look at the following graphs I made with Perplexity. How do you interpret the data?

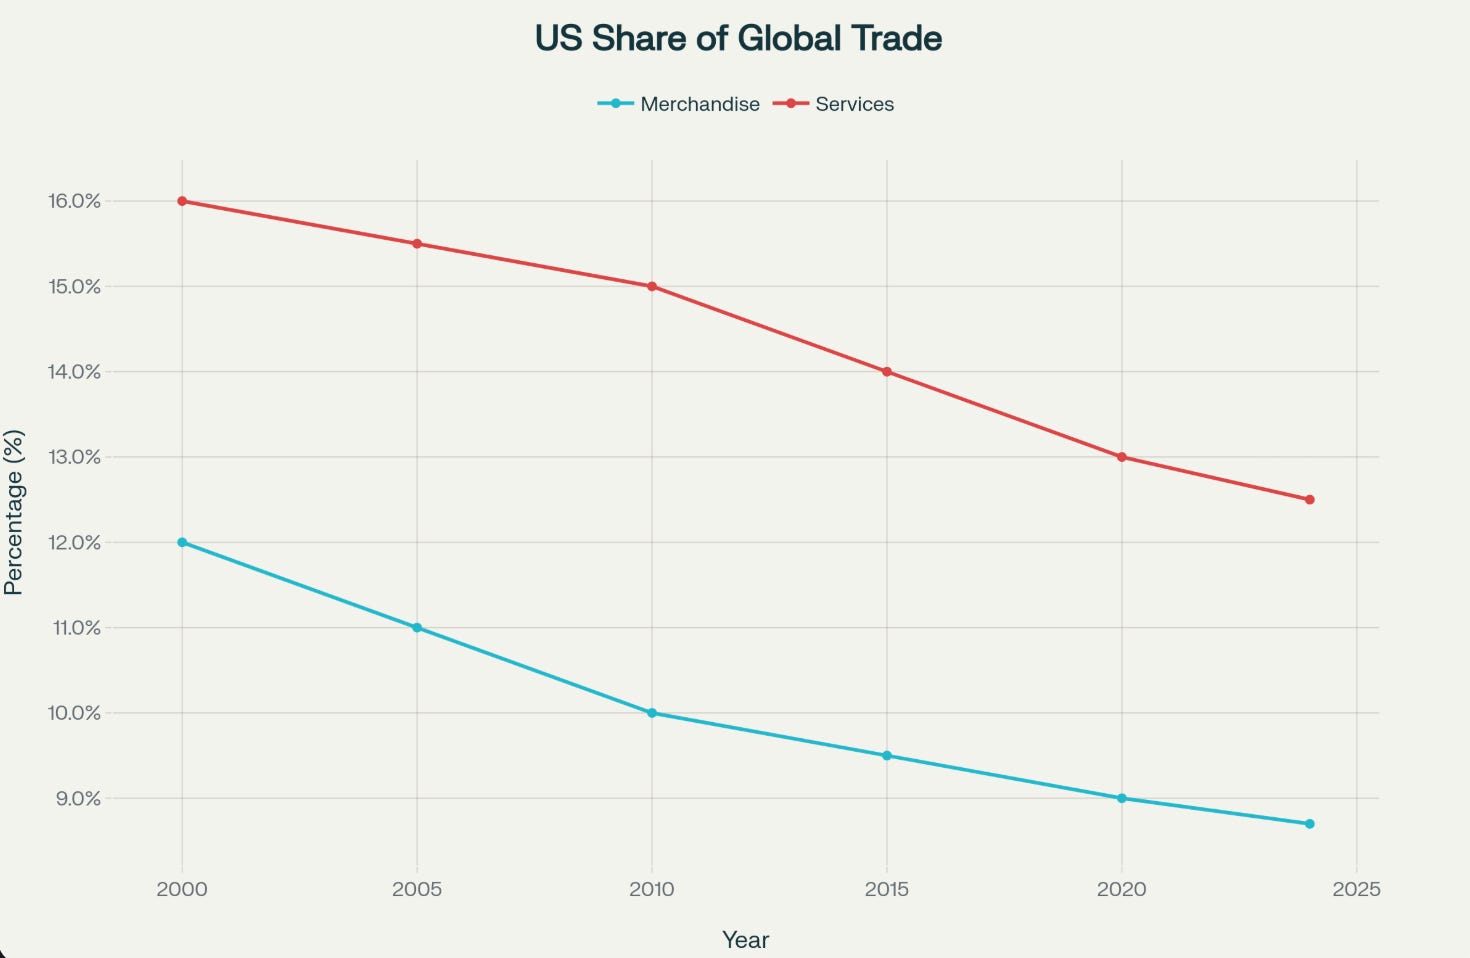

So which is it?
Is the USA a naughty, nefarious global hegemon? - maybe
Is the USA losing global trade market share? - yes
Is that a bad thing? - maybe
Is that a good thing? - maybe
Is it logical that leaders of any enterprise might want to increase market share, especially after a steady 25-year decline? - probably
Now let’s come full circle.
In light of declining market share and diminishing Service Levels (reflecting back on that pesky NHS’s SLR of 10%) - is it any wonder that special interest groups and new administrations are grabbing power in the USA, UK and other non-emerging markets?

This is a complicated issue with many twisty turns.
If you want to chat more about this please leave a comment below and I’ll get back to you; and / or set up a discussion group event if there is enough interest.
Thanks for reading.
Buy some coffee to support my writing. It is literally some of the best in the world.